
Don't Be Square!
An Exploration of ![]()
by
Sarah Major
This write up is based on Problem # 9 from Exploration 1, which is the following:
Graph

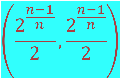
What do you expect for the graph of
![]()
or
![]()
When graphing the first four equations in this problem, I came up with the following graph in Graphing Calculator 4.0:

The first similarity that I see between the graphs is that they all have a y-intercept through 1, and also an x-intercept through 1. This is because of the property that for each point on the graph of the equation, the x-coordinate raised to a power plus the y-coordinate raised to the same power must equal 1. If one coordinate for the point is already 1, the other coordinate must be 0 to make the equation true for any value of the degree.
The second property I notice is that the equations with an even-numbered degree produce closed figures while the equations with an odd-numbered degree produce graphs whose domains go from negative infinity to infinity. Why is this distinction present? Let's change the format of the equation so that it is set equal to y:
![]()
![]()
From this form, we can see that when the degree, n, is even, the value under the radical must be positive to be able to appear in the x-y plane. This is why the domain for the even-numbered degrees is restricted to being between -1 and 1. Any other value would cause the value under the radical to be negative and thus create a complex number. However, this is not the case for the odd-numbered degrees because negative values under the radical would not produce a complex number. Noting this distinction, I will now separate these equations into even degree and odd degree to note different properties that they hold.
First, I will focus on the equations with even numbered degrees. Here is a graph of the equations for n=2,4,...,10 produced from Geometer's Sketchpad 5.0 (note that I had to set the equations equal to y to be able to graph them in this software):

From a visual perspective, I notice that as n increases, the figure goes from being a circle to looking more like a square. This leads me to believe that the x and y-values in the corners are approaching 1 and -1. By corners, I mean the points on the graphs appearing at 45°, 135°, 225°, and 315° when thinking of the unit circle. One could also say that the values I am referring to are the intersection of the respective graph with the equation y=x.While the first equation produces a circle where all of its points are equidistant from the origin, this is not the case for any of the other equations. As we have previously specified, the x and y-intercepts remain the same, but the values in the corners steadily increase but are always less than 1. Let's add the figure of a square with side length 2 passing through the same intercepts to compare:

As the figure shows, the points in the corner seem to come closer and closer to the vertices of the square but never reach them. Will they ever reach them? We can figure this out by looking at the actual coordinates of these points for each graph. For the sake of this analysis, I will only focus on the coordinates at the 45° location since the absolute values of the coordinates will be the same for all of the corners from having symmetry with the y-axis.
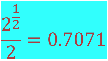
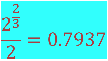
We know from working with the unit circle that when the degree of this equation is 2, the coordinates will be:

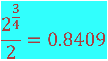
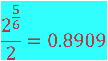
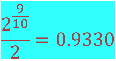
However, if we calculate the coordinates for the other even degree equations, we find these coordinates:
,
,
,
This creates a very nifty pattern based on the value of n:

This can be simplified even further to make the coordinates easier to work with:
In this way, we can predict any value that appears in the corners based on the degree located in our equation. This will come into play later on in this discussion. Going back to the coordinates above, we can display the values that put their location into perspective:
 ,
,  ,
,  ,
,  ,
, 
As stated earlier, the values come closer and closer to 1 but are never actually 1. Therefore, though the figures created look more and more like a square, they will never actually become a square.
We can now extend these ideas to the equations with an odd degree. Let's graph the equations for n=3,5,...,9 using Geometer's Sketchpad:

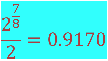
The part of the graph located in the first quadrant looks strikingly similar to the even degree equations. When we focus on the 45° location like in the previous section, we can see that corner on this quadrant displays the same visual and numerical properties as the previously examined even degree equations. This part of each figure seem to be going from a circular figure to that of a square, and to confirm this, the pattern described earlier holds for the top right corner of these figures. Below are listed the coordinates for each equation for the top-right corner for the graphed equations along with their values brought into perspective:
 ,
,  ,
,  ,
, 
Now, combining these values with the values of the even degree equations, we get the following values for n=2,3,...,10:
So, as n progresses, the value becomes closer and closer to 1 but never actually reaches 1.
As we have seen from the graph of the odd degree equations, the portion of the graph in the first quadrant looks similar to the even degree equations in that it goes from a circular figure to looking more like a square. However, how do we explain the parts of the graphs in the other three quadrants and how strikingly different it is from the even degree equations? From our discussion of the even degree equations, we know that even roots are restricting in their domain because the value under the root cannot be negative. However, this is not the case for odd roots. Therefore, we are able to compute odd roots for negative values under the radical. Let's use the equation for n=3 to compute some of these values:
At first glance, we can see that each value for a positive x corresponds to being the negative of its corresponding negative x value. This means we have symmetry along y=x, which is one of the properties of odd functions. Also, the absolute value of y increases as x decreases from -1 or increases from 1. This explains the tails in these domains. However, how do we explain why the absolute value of y increases less rapidly as n increases? The reason is we are computing the following value when trying to find y:
![]()
As n increases for a certain value of x, the absolute value of the y value decreases. Let's compute the y values for x=-2 for for the odd values of n; that is, n=3,5,...9:
So, because the process of finding the y-value involves raising the x-value to an odd power, subtracting it from one, and then taking the same odd-numbered root, the absolute value will increase more slowly for a higher odd number. What is unique about these numbers as n increases is that they get closer and closer to the negative of their value. In other words, the graphs of the odd-number degree equations are approaching y=-x, and they do so faster and faster as n increases. As we can see from the graphs of these equations, it does look like these graphs are always approaching this line.
So, with all of the above mentioned properties and discussions, can we answer the last part of problem #9?
What do you expect for the graph of
![]()
or
![]()
Well, we know from our discussion of the even degree equations that if n=24, the graph of the equation will be a closed figure. Also, since n is larger than the equations we have already graphed, it will look more like a square than the previous n.
Specifically, we can create create a figure from the coordinates we are able to find. From previous discussions, we know that the graph will always have x-intercepts of -1 and 1 and y-intercepts of -1 and 1:

We can also find the values in the corners:

So, we can plot these values in their respective quadrants:

Now, it's just a matter of connecting the points and making sure the figure looks more like a square than the previous figures:

We can go thru the same process for n=25. First, we plot the x and y-intercepts:

We can then find the value of the corner in the first quadrant:

We can then plot this value for the coordinates in the first quadrant:

Now that we have these three points, we can create the part of the graph in the first quadrant that resembles the figure looking somewhat like a square:

Now, we just have to figure out how to draw the tails. We know that as the absolute value of x increases, the absolute value of y increases. We also know that as n increases, the absolute value of the y values increases at a slower rate. Specifically, we know that the values are approaching y=-x and becoming closer as n increases. We can assume at this point that since n is so large, the points will be significantly close to this line. Let’s compute the values and see:
These values are not actually these exact values. They are just a product of rounding. We can then plot these coordinates and create the rest of the graph:

What if we extend this problem to when n is a fraction? That is, ![]() . There are different fractions to consider. The first group of fractions I will consider is when the numerator is 1, and the denominator is a grater value. The second group I will consider is when the numerator is not one, and the denominator is a greater value (though the whole value of the fraction is fairly close to 1). The third group I will analyze is when the value of the fraction is greater than 1.
. There are different fractions to consider. The first group of fractions I will consider is when the numerator is 1, and the denominator is a grater value. The second group I will consider is when the numerator is not one, and the denominator is a greater value (though the whole value of the fraction is fairly close to 1). The third group I will analyze is when the value of the fraction is greater than 1.
In reference to the first group, I used the values of 1/6, 1/5, 1/4, 1/3, and 1/2 to begin with:


The first thing I notice is that the graphs are the “opposite” of the previous graphs. That is, instead of the “corners” pointing away from the origin, they are now pointed towards the origin. Intuitively, we can see that this if we rearrange our equation:
![]()
Since ![]() , x, which is also less than one, is being raised to a power instead of a root being taken like in the previous equations. This causes the y-value to become smaller and smaller at a fast rate, which makes the graph seem like it is “pointing” towards the origin.
, x, which is also less than one, is being raised to a power instead of a root being taken like in the previous equations. This causes the y-value to become smaller and smaller at a fast rate, which makes the graph seem like it is “pointing” towards the origin.
Also, the "corner" portion of these graphs seem to be approaching a graph of a line segment. This makes sense because the values cannot be 1 or more. Furthermore, the equation ![]() is indeed a line, and this is the line that the graphs seem to be approaching because they actually are approaching this equation. However, after this line is when the domain is allowed to be more than 1.
is indeed a line, and this is the line that the graphs seem to be approaching because they actually are approaching this equation. However, after this line is when the domain is allowed to be more than 1.
But how do we explain the tail on the equation with a degree of 1/5? My initial thought is the equations with the even denominator are restricted in their domain because we cannot take even roots of negative number without getting complex values. However, how come the 1/3 degree equation doesn't have tails? In the range of this particular graph, it looks like it does not have tails, but if we extend farther out, say to where the x axis extends to around 6, we will be able to see a tail. Therefore, for degrees where the numerator is 1 and the denominator is even, the domain is restricted because we cannot take even roots of negative values. However, like we previously discovered, odd values are not restricted in this way, hence the tails.
What if the numerator is not 1? What about values that are closer to 1? Lets plot equations whose degrees are 2/3, 3/4, 4/5, and 5/6:


These graphs are similar to the graphs of the even degree equations in that they seem to be approaching a square. However, this square is rotated 90°, so it is more of a diamond. Like the previous fraction degrees, however, the "corners" are pointing inwards instead of outwards due to the characteristics of the equation. Once again, the domain and range is restricted to being between -1 and 1 due to the equation being equal to 1.
The last group I will analyze is equations for which the degree is a fraction that is greater than 1. I will use the values of 3/2, 4/3, 5/4, and 6/5:


Like the previous group, these seem to be approaching a diamond. Like the even degree equations were analyzed previously, the seem to be going from a circular figure to that of the square (in this case, diamond). Instead of the corners pointing "inward" like the previous group, however, the corners are pointing "outwards" like the whole number degree equations we analyzed previously because they are greater than 1.
Therefore, we can come up with the following characteristics of our general equation when the degree is a rational number (or fraction):
When a is 1 and b is an even positive integer, the graph will be a single "corner" pointing towards the origin in the first quadrant.
When a is 1 and b is an odd positive integer, the graph will also have a single "corner" point towards the origin in the first quadrant, but it will also have tails extending into the second and fourth quadrants.
When a/b is less than 1 but the numerator is not 1, the "corners" that are approaching inward towards the origin begin to approach the figure of a diamond.
When a/b is greater than 1, the "corners" point away from the origin, and the figures created by the graphs go from a circular figure to that of a diamond.
